Why is mobile application analytics important for product development?
User behaviour analysis is an essential element in the process of building and developing digital products. It enables a deep understanding of needs and preferences, and by monitoring interactions with the product, we can better tailor its features and experience to user expectations.
Data analysis plays a key role in optimising, personalising and guiding the development of mobile products, which translates into better meeting customer needs and increasing their satisfaction. Identifying areas where users encounter difficulties and tracking this data gives us the opportunity to increase conversion and user engagement. Detecting key moments that lead to success (e.g., making a purchase) or cause users to abandon the process (e.g., registration) is the beginning of defining opportunities and problems, and in the next stage, addressing them precisely.
Product analytics is not only a tool for improving user experience, but also a powerful engine for supporting the achievement of business goals. Mobile app analytics opens the door to understanding users at a level that was previously unavailable, offering a unique opportunity to gain a deep understanding of their needs and preferences.
Data collection in mobile analytics must be specifically targeted at metrics that directly relate to pre-defined goals. Data analysis allows for continuous product improvement, better business results, increased customer satisfaction, and improved retention and engagement.

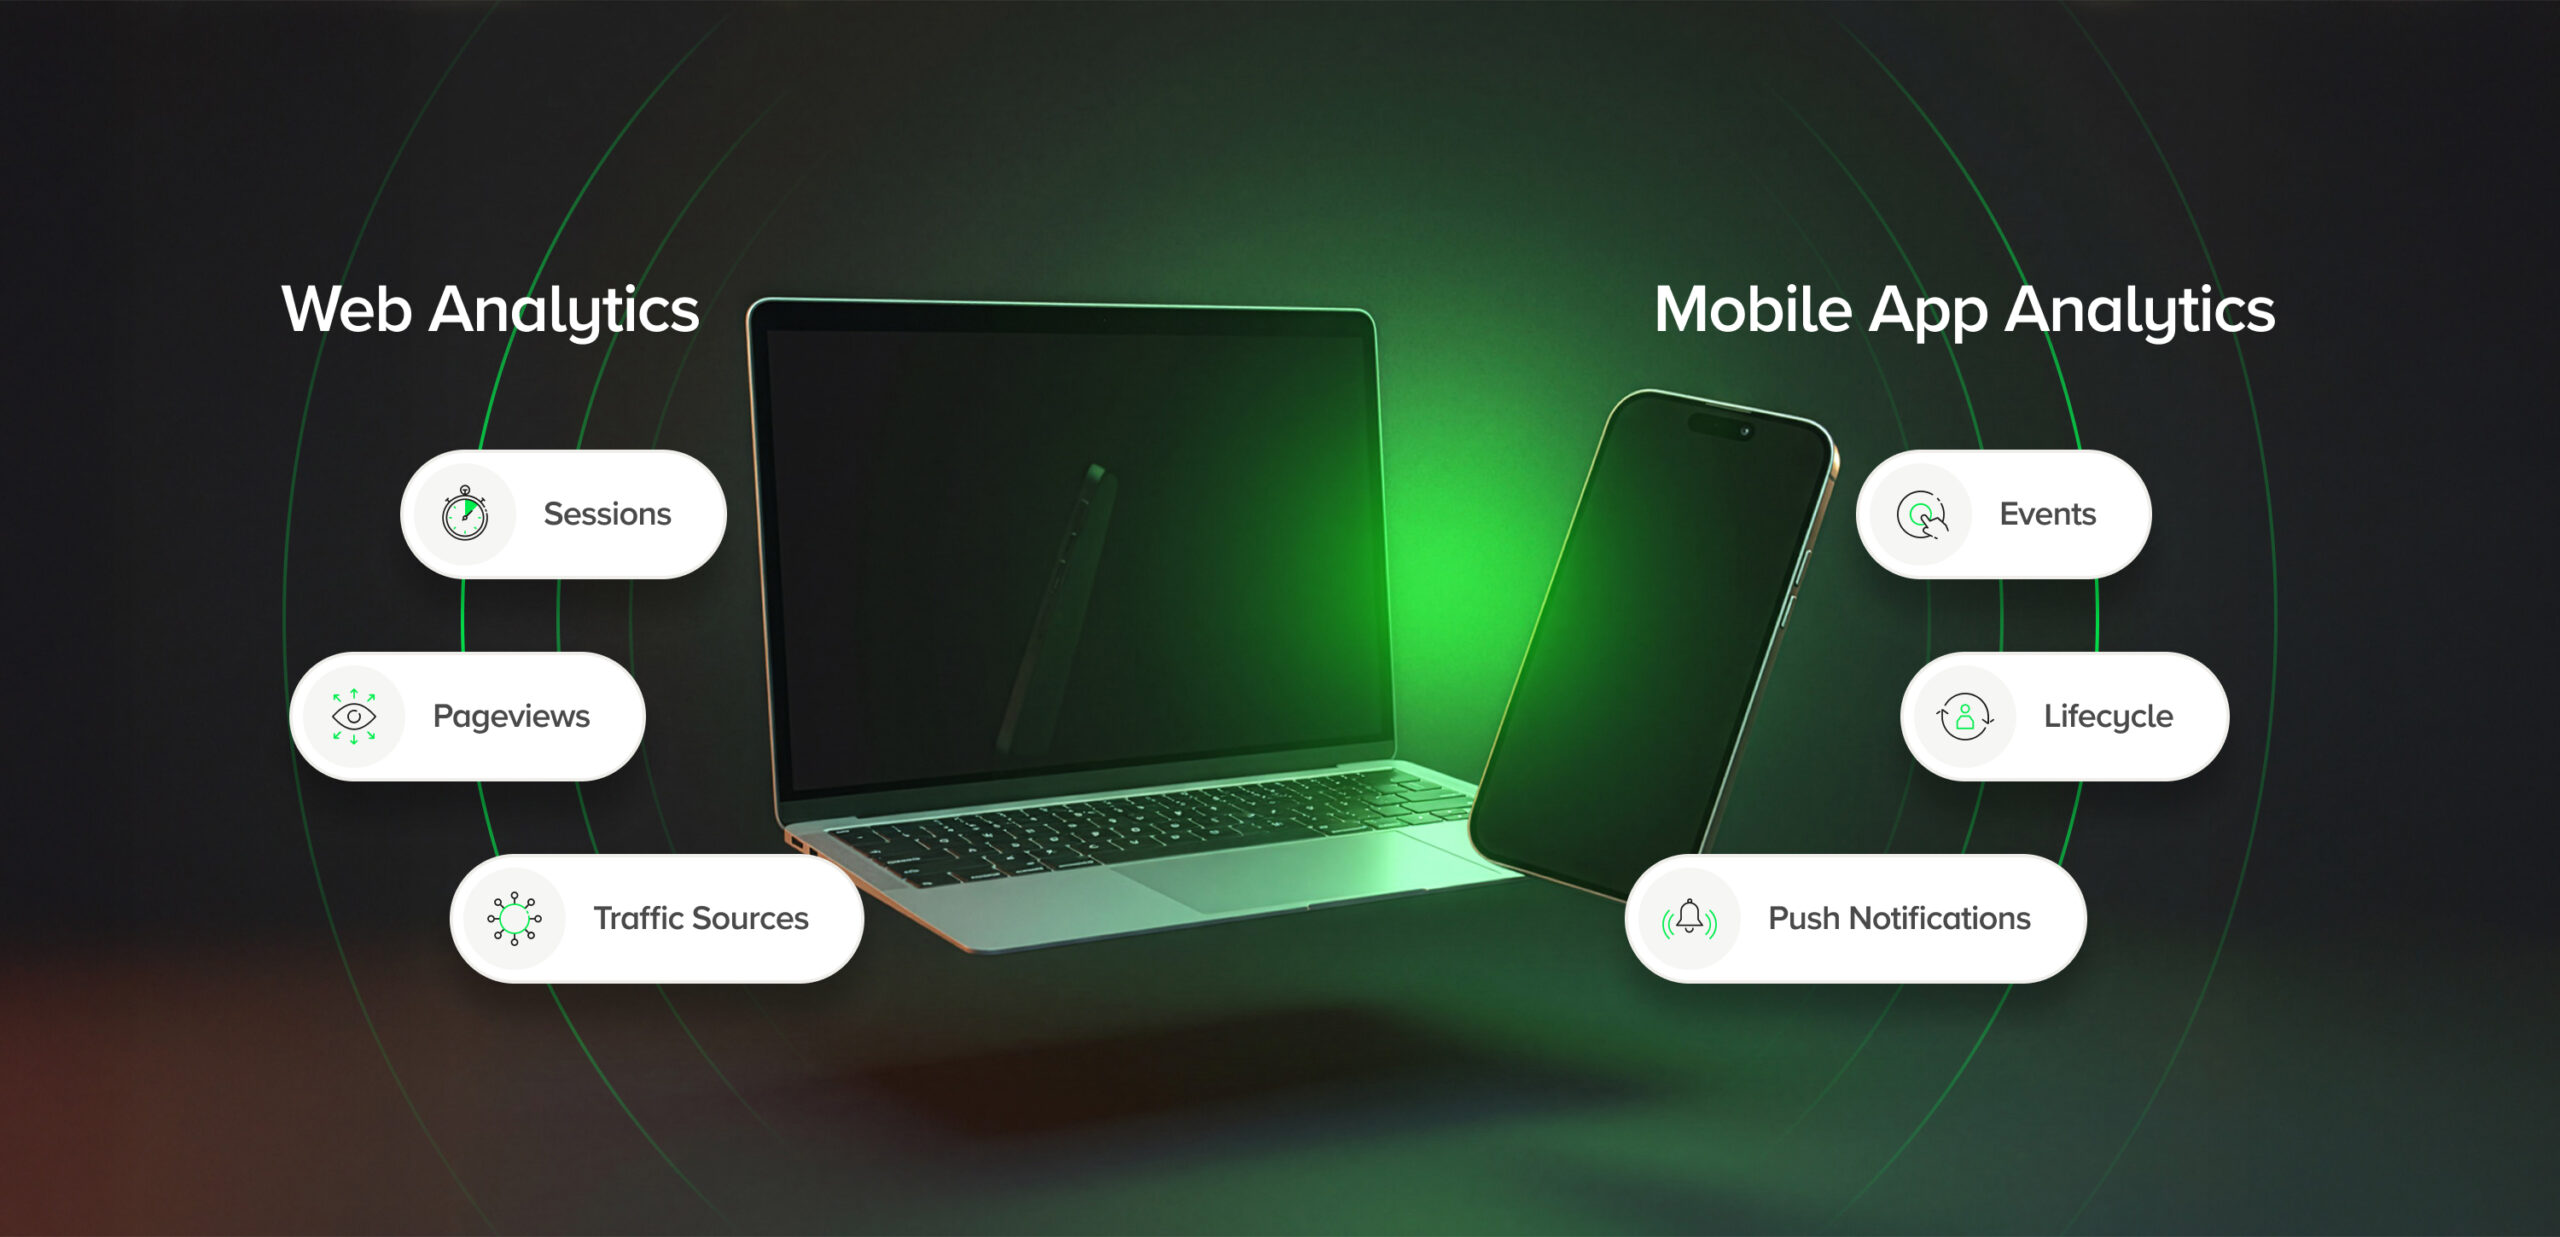
Website analytics and mobile application analytics – key differences
Although the business objectives of websites and mobile applications may be similar, the way data is collected and interpreted differs significantly. Web analytics focuses mainly on traffic, page views and traffic sources. Mobile app analytics covers much more complex interactions, such as:
- event-based analytics,
- push notifications,
- location,
- mobile-specific behaviours,
- user lifecycle.
In analytics tools such as Google Analytics 4, tracking is based on events that record various user actions within the application.
Mobile interfaces and design patterns are tailored for shorter, more frequent, and contextual interactions, which directly affects the interpretation of metrics. Mobile app analytics collect both quantitative and qualitative data, with quantitative data allowing for quick measurement of trends and effectiveness of actions.
User context and its impact on data
The situation in which the user uses the mobile application is crucial for data interpretation. Applications are used on the go, at work, at home or ‘in the background’ of other activities. User expectations change with the context. Analysing user behaviour in different situations allows for a better understanding of their needs and adaptation of the application.
For example:
- weather applications see peak traffic in the morning and evening,
- airline and transport applications often achieve success thanks to very short sessions – low time spent in the application can mean great UX.
Monitoring their behaviour in different situations when using the application is crucial for optimising the experience.

App usage on the go – impact on engagement
When users engage with mobile applications while on the move (e.g., on public transport, while walking, in a car), their interactions are more fragmented and short-term. This means that the analysis must take into account:
- Short interaction: Users on the go may quickly open the app, perform a single task (e.g., check a message, verify an order status), and then close the app. In this case, the average time spent in the app may be short, but the frequency of sessions will be higher.
- Increased number of sessions: In mobile applications, users may visit them more frequently in short intervals, e.g., checking them several times a day during the working day. This affects the analysis of metrics such as the number of sessions per user.
- Mobility and interrupted interactions: An application can be used at different times of the day and in different places, and users may interrupt sessions (e.g., pause them when they need to perform an action, such as crossing the street). It is also worth analysing how users move through the different stages and screens of the application, which allows for a better understanding of their paths and behaviours and optimises the entire process of using the application. Therefore, the analysis must take into account the termination and restarting of sessions in different contexts.
Push notifications and their effectiveness
Push notifications are an important element of mobile applications, but their effectiveness depends on the context in which they are received. Analysing the circumstances in which users respond to notifications allows for better tailoring of notification content to user behaviour and activity at a given moment.
It is also worth analysing the effectiveness of push notifications in the context of social media activities, which can influence the number of app downloads and user engagement.
User segmentation – the foundation of personalisation
The idea behind mobile applications is to be close to the user, providing them with support, entertainment or immediate responses.
They accompany users on a daily basis – they are available in their pockets, on their devices, which means that interactions with the application must be as personalised and tailored to individual needs as possible. That is why advanced user segmentation is extremely important, as it helps to better understand the audience and their unique needs.
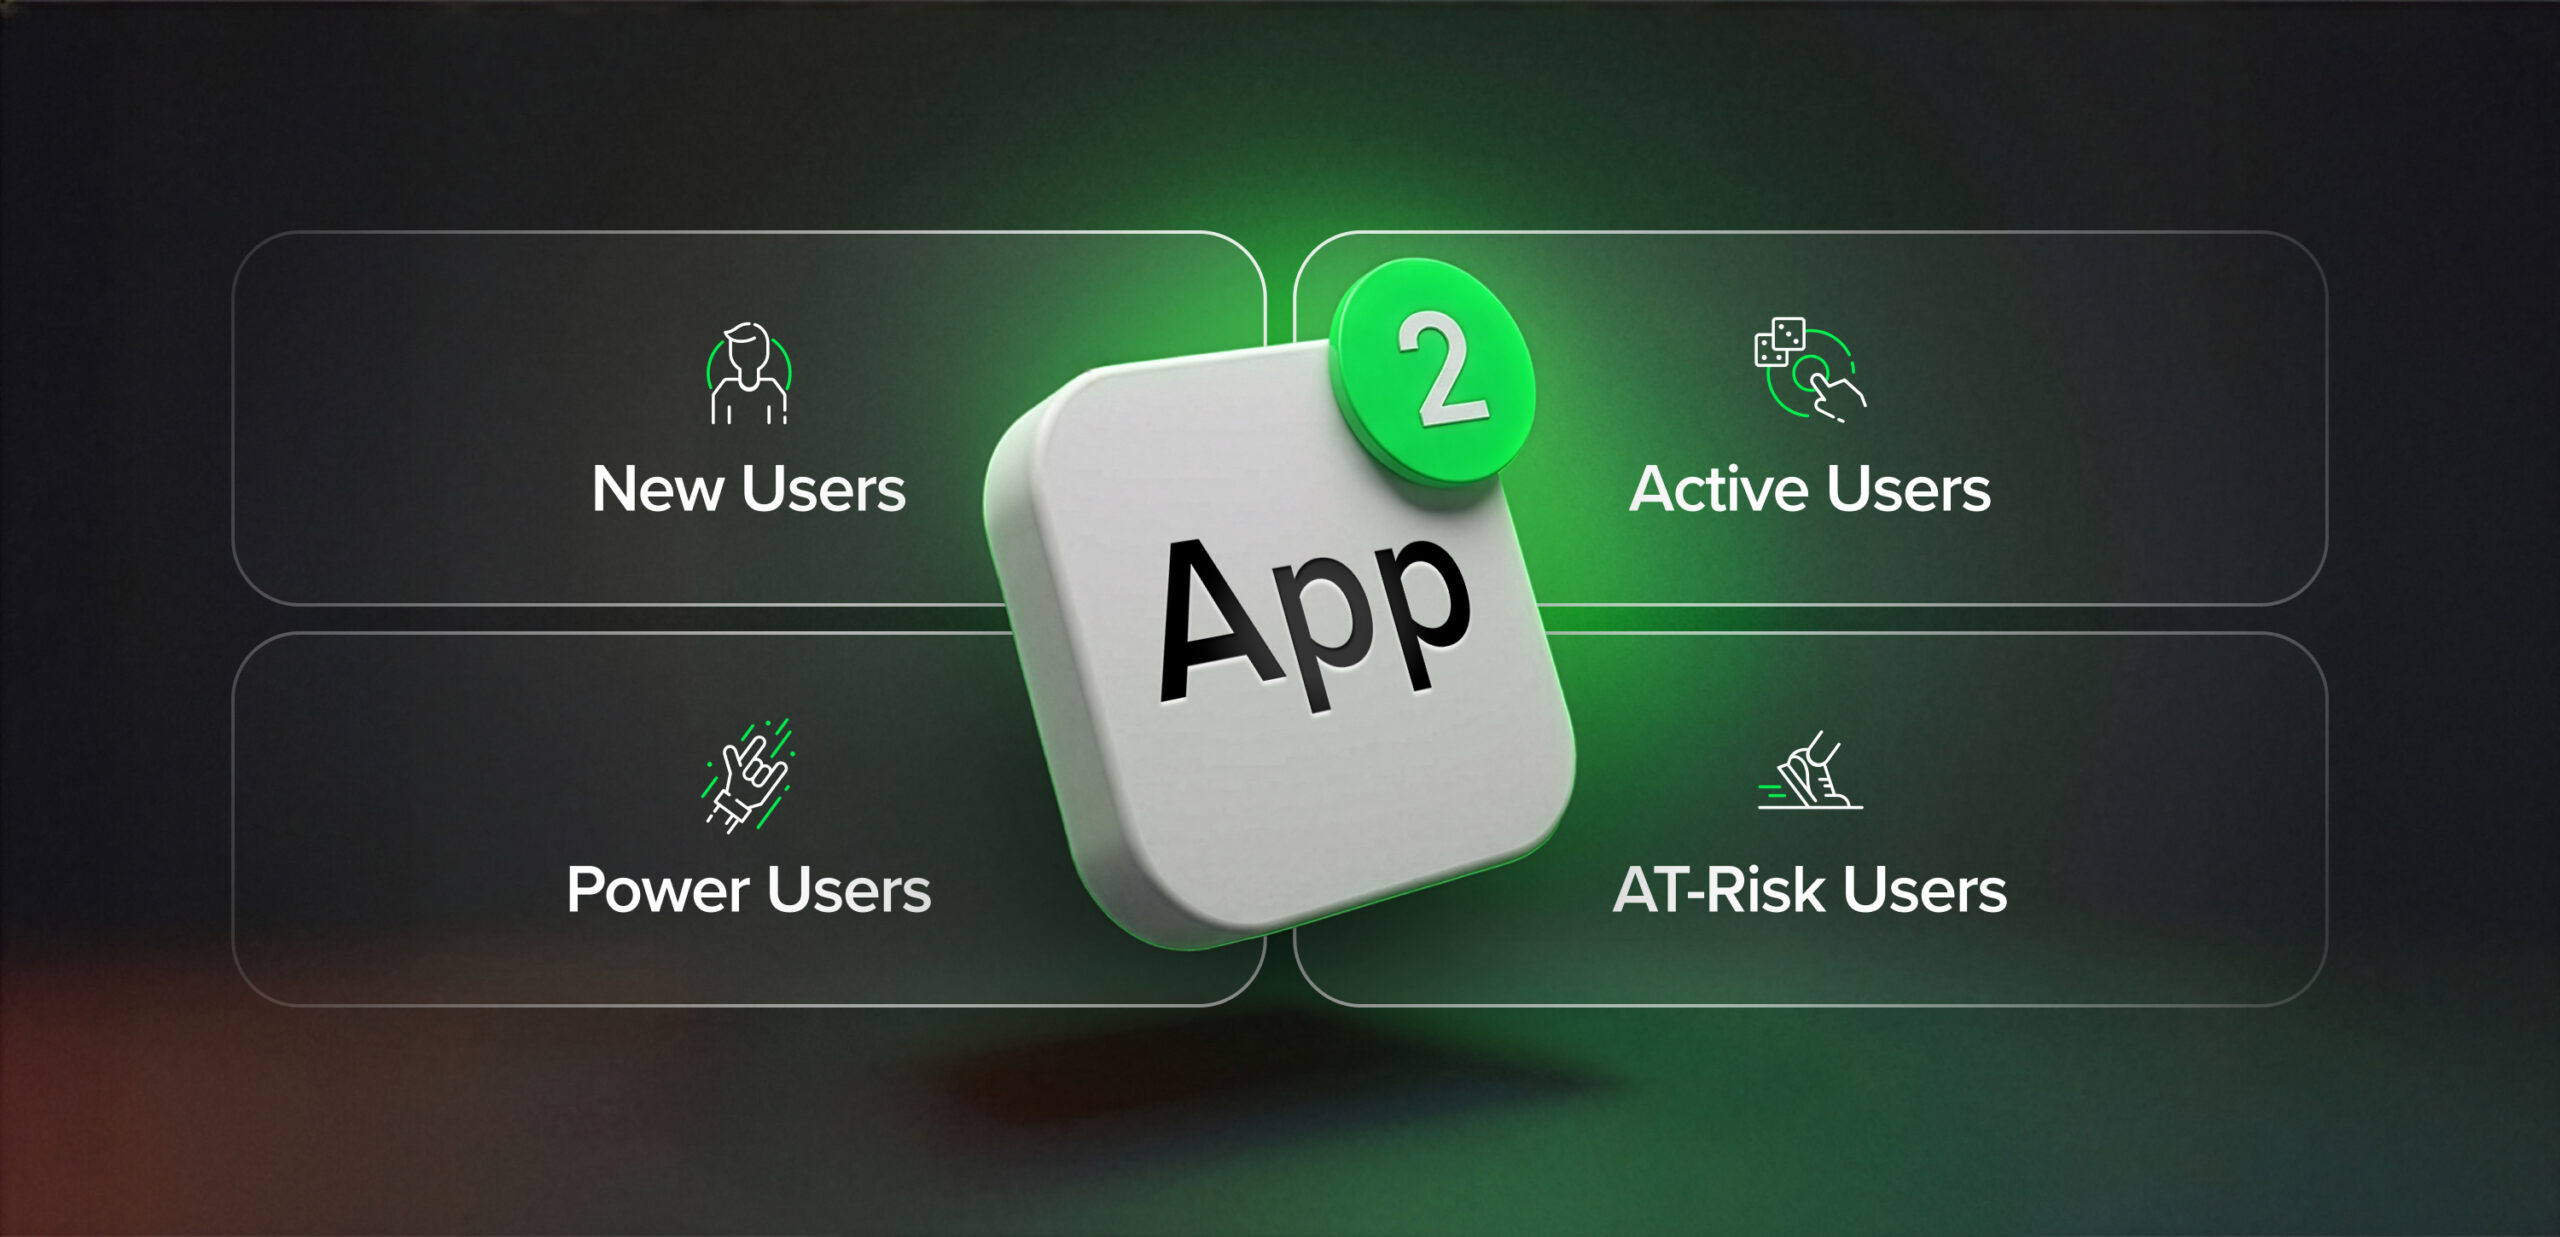
Why is advanced user segmentation important?
Advanced segmentation allows you to create more personalised experiences within your app. For example, if users use the application for different purposes (e.g. shopping, entertainment, education), segmentation allows you to tailor content, notifications, offers and recommendations to their individual preferences and behaviours. This makes users feel more engaged and motivated to continue using the application.


All of this allows you to create a more human and tailored experience that attracts users and encourages them to use the app more often. Without segmentation and proper customisation, the application becomes just another icon on the phone, rather than something that attracts the user for longer. Closer to the user means not only availability on their device, but also adapting to their expectations and providing a valuable experience.

Key metrics in mobile application analytics
It all depends on the type of application we are creating and the value proposition we are presenting to users, but there is a basic set of metrics that should draw our attention at the so-called start.
One of the key indicators is the number of users, which allows us to assess the popularity of the application. Another important measure of activity is the monthly number of users, which allows us to analyse behaviour over a specific period and supports product development planning. In mobile analytics, it is important to collect not only quantitative data, but also qualitative data in order to understand the reasons behind user behaviour.
1. Active users
It indicates how many active users are using the application at a given time, which is a key indicator of engagement:
- DAU (Daily Active Users)
- WAU (Weekly Active Users)
- MAU (Monthly Active Users)
The monthly active users (MAU) figure shows how many unique users have used the application in the last 30 days.
2. User retention (Retention Rate)
The user retention rate determines what percentage of users return to the application after their first use, e.g. 1 day, 7 days, 30 days after downloading.
The user retention rate is crucial to the commercial success of mobile applications and should be analysed in the context of user cohorts to better understand and improve user retention. Retention is a key indicator of an application’s success because it helps to understand how well the application retains users in the long term.
3. Average time spent in the application (Average Session Duration)
The average time spent in the application measures how long users remain active during a single session and is one of the most frequently analysed engagement metrics. In practice, however, its interpretation should always depend on the context of the application and the goal it is intended to achieve.
A longer time spent in the application may indicate high user engagement, but it may also signal usability issues, such as unintuitive navigation, overly complicated processes, or difficulty in finding key features.
For applications designed to deliver specific value quickly (such as banking, transport, or airline applications), short session times may be a sign of success rather than a problem. If the user quickly completes the intended task (e.g., checks their balance, downloads their boarding pass, confirms their reservation), it means that the application is performing well and is not generating unnecessary friction.

4. Number of sessions per user (Sessions per User)
It determines how many times users launch the application within a specific period of time. A high rate may indicate that the application is well received and users return regularly. It is worth analysing the number of sessions per user in relation to the number of application installations, which allows you to assess the effectiveness of marketing activities and the popularity of the application.
5. Conversion Rate
Measures the percentage of users who have performed desired actions in the application, such as making a purchase, subscribing, registering, or completing a specific stage in the application (e.g., completing an online course). This is important in the context of business objectives.
6. Customer Acquisition Cost (CAC)
It measures the average cost incurred by a company to acquire a new user, e.g. through marketing campaigns, advertisements, promotions. The cost of user acquisition can be analysed in the context of various channels, such as Google Play, which is one of the main sources of app installations. It is an important indicator for assessing the effectiveness of marketing activities.
7. Average Revenue per User (ARPU)
It determines the average value generated by a single application user, taking into account all sources of revenue, e.g. in-app purchases, subscriptions, advertisements.
8. Engagement Rate
The engagement rate determines the extent to which users actively interact with the application, rather than just opening it. It can include activities such as clicking on interface elements, using key features, responding to messages, performing specific actions, or the frequency of returning to the application. Unlike simple reach metrics, the engagement rate better reflects whether the application actually provides value to users.
As with other behavioural metrics, a high level of engagement does not always mean the same thing for every type of application. In entertainment or social applications, it may be a direct goal of the product, while in transactional or productivity applications, engagement should be analysed in the context of task completion effectiveness. Intensive interaction may indicate interest, but it may also signal that the user has to take too many steps to achieve their intended goal.

9. Lifetime Value (LTV) and User Lifetime
The predicted value of an app user throughout their entire lifecycle. LTV helps you understand how much a user is worth in the long term, which is essential for assessing the profitability of an app. User Lifetime defines the average time a user uses an application, from the first download to the moment they stop using it. A shorter life cycle may indicate problems with engagement or the application itself.
10. Churn Rate (User attrition rate)
Measures the percentage of users who stopped using the application during a given period. Churn is an indicator that helps you understand how well the application retains its users.

Tools for mobile application analytics
Choosing the right analytical tools is crucial for effective data monitoring and optimisation of mobile applications. Appropriate tools, such as software development kits (SDKs) or development kits, enable the integration of analytical functions into mobile applications at the programming stage.
SDKs are pieces of code (software) that allow you to track events and collect user data, which is essential for effective mobile application analytics. Early implementation of AI in mobile application analytics can support forecasting and personalisation of user experiences. Detecting problems in mobile applications allows for the identification of user difficulties, quick bug fixes, and UX improvements.
The most commonly used mobile application analytics tools include Firebase Analytics, Mixpanel, Amplitude, Pendo, and Adjust, as they offer advanced features specific to mobile applications. Tools such as Firebase, AppFlyer, Mixpanel, and Amplitude are commonly used to collect data about mobile application users. This does not mean that other tools that offer analytics for both applications and websites will not work – they can be good for starters, and over time you can expand your ‘toolbox’.
The practical use and application of analytics tools enables informed business decisions and optimisation of application development strategies.
How to get started with mobile app analytics?
Analytics without context and both product and business objectives will not bring us measurable benefits. Mobile application analytics should be focused on objectives and indicators specific to our mobile application in order to effectively analyse data and optimise activities in the context of our application. How can we make data-driven decisions if we do not know what we want to achieve? How can we prioritise implementations if we don’t know what is most important for the product/business?
Before we dive into tools and data collection, it is worth determining how our product interacts with users and what business goals the client sets for the product. Analytical goals should be formulated according to the SMART (Specific, Measurable, Achievable, Relevant, and Time-Bound) principle, which allows us to better measure the progress and effects of actions in our mobile application. Regularly returning to your assumptions and adjusting your action plan according to changing conditions is key to the success of your application. Product goals are the result of caring for the user experience while striving for business success.
Types of applications based on the primary purpose of user interaction
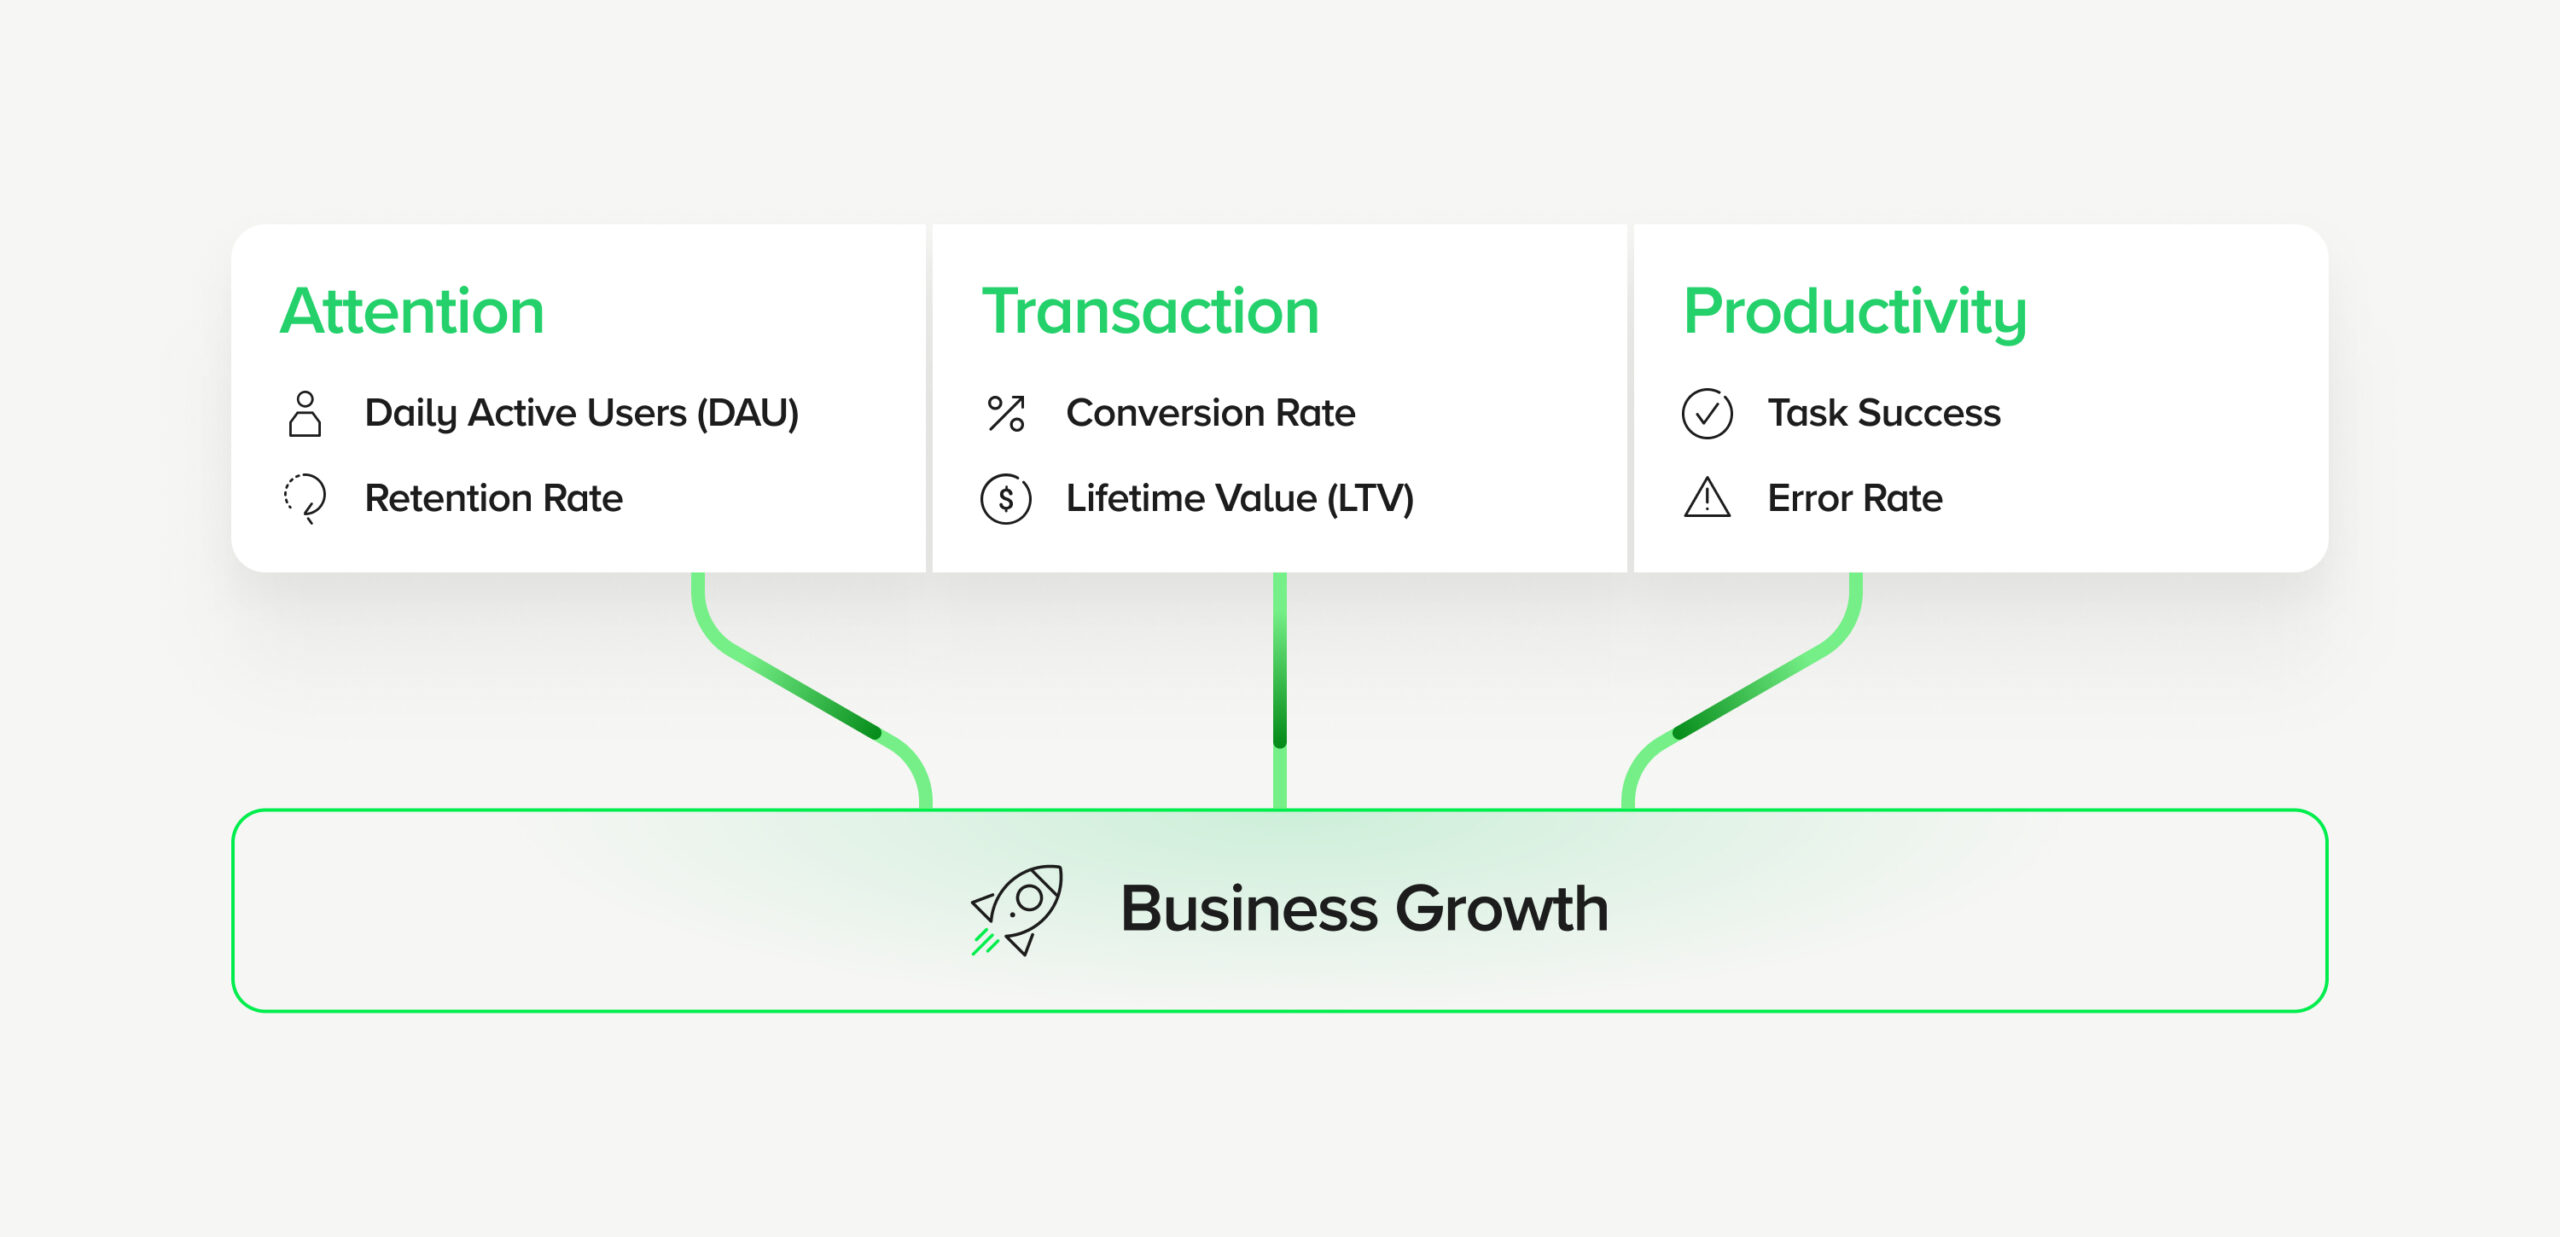
Understanding what game our product is playing is important because each application has different goals and models of interaction with users. We can distinguish three main categories:
- Attention – applications that focus on attracting users’ attention and engaging them, e.g. social media, entertainment and information applications. The goal of such applications is to generate as much engagement as possible.
- Transaction – applications that enable specific actions to be performed, such as shopping, payments, and reservations. A typical example is e-commerce applications, where mobile application analytics allow for detailed analysis of the purchasing process, tracking of transactions and conversion funnels, which is key to understanding user purchasing behaviour.
- Productivity – applications that help users organise, manage tasks and increase efficiency (e.g. calendars, project management applications). The goal is to improve efficiency and deliver value in the form of time savings and increased productivity.
Mobile application analytics as a process, not a project
Mobile app analytics is not a one-time implementation or a set of reports created ‘in advance.’ It is a continuous process of learning about the product and users, which requires regular verification of assumptions, iteration, and adjustment of metrics to current business goals. Regular data analysis enables continuous improvement of the app and better fulfilment of user needs.
Mature teams treat data as a starting point for conversation, not a final answer. Numbers help ask better questions: why do users behave in a certain way, what really provides them with value, and which elements of the product need to be simplified rather than expanded.
From data to decisions
The greatest value of mobile analytics is not dashboards, but the decisions we make based on them. Effective analytics:
- combines the user’s perspective with business goals,
- allows you to prioritise product development,
- supports marketing, sales and operational teams,
- reduces investment risk in application development.
Only then does data begin to work towards the success of the product.
Summary
Today, mobile applications compete not only in terms of functionality, but above all in terms of experience and the ability to adapt to the user. Without well-designed analytics, it is difficult to understand what actually works and what just looks good on the roadmap.
Conscious measurement, proper interpretation of data, and consistency between product and business goals allow you to build applications that are not just another icon on a smartphone screen, but a real tool that delivers value – both to users and to the organisation.

Would you like to better understand the data from your mobile application?
Analytics is more than just collecting metrics. We help product and business teams interpret user data, define the right metrics, and make informed decisions based on them – from engagement and retention to achieving business goals.
Author
Małgorzata Dolińska-Amrozik
Head of Product Design
Head of Product Design and Product Designer at SYZYGY Warsaw, where she bridges the gap between complex business challenges and user-centric solutions. She works with clients from the very beginning, conducting workshops and discovery processes to ensure that the right problems are being solved.
She helps teams transform insights into effective digital products, supporting a culture of continuous improvement and data-driven decision-making.
Her work is based on a fundamental belief: the best products are created when business goals, technological feasibility and real user needs are perfectly aligned.
She focuses on agility, workshop-style collaboration, and bold design decisions.